Technical analysis is a method of evaluating securities by analyzing statistics generated by market activity, such as price and volume. Traders use a variety of technical indicators to identify potential trading opportunities. However, not all indicators are created equal. This article explores which technical analysis indicators are most effective in predicting price movement and how to use them wisely.
Understanding Technical Indicators
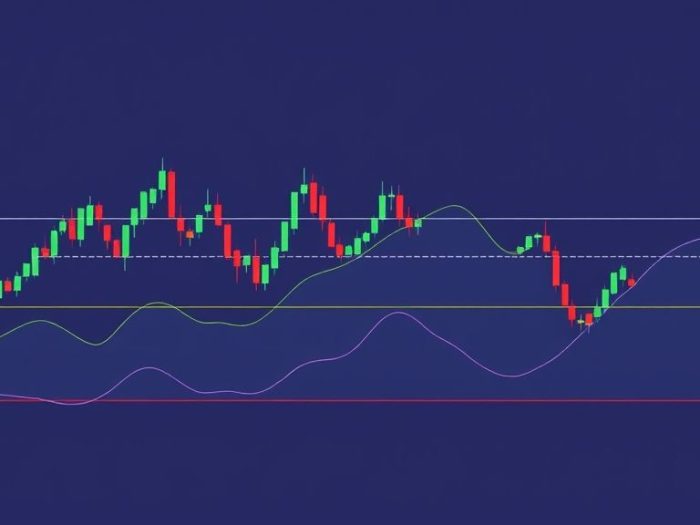
Technical indicators are calculations based on historical price and volume data that aim to forecast future price movements. They can be categorized into several types:
- Trend Indicators: Help identify the direction and strength of a trend.
- Momentum Indicators: Measure the speed and rate of change of price movements.
- Volume Indicators: Analyze trading volume to confirm price trends.
- Volatility Indicators: Gauge the degree of price fluctuations.
Effective Technical Indicators
While no indicator is foolproof, some have shown greater reliability in predicting price movement when used correctly:
1. Moving Averages
Moving averages smooth out price data to identify trends.
- Effectiveness: Useful for identifying support and resistance levels, as well as trend changes.
-
How to Use:
- Look for price crossovers above or below moving averages as potential buy or sell signals.
- Use longer-period moving averages to identify long-term trends.
2. Relative Strength Index (RSI)
RSI measures the magnitude of recent price changes to evaluate overbought or oversold conditions.
- Effectiveness: Helps identify potential reversals when the market is overextended.
-
How to Use:
- Consider buying when RSI is below 30 (oversold) and selling when RSI is above 70 (overbought).
- Look for divergences between price and RSI to signal potential trend changes.
3. Volume
Volume represents the number of shares or contracts traded in a given period.
- Effectiveness: Confirms the strength of price trends and breakouts.
-
How to Use:
- Increasing volume during a price trend strengthens the trend.
- Low volume during a breakout may indicate a weak move.
4. Fibonacci Retracements
Fibonacci retracements are horizontal lines that indicate areas of support or resistance based on Fibonacci ratios.
- Effectiveness: Helps identify potential price targets and reversal points.
-
How to Use:
- Look for price to retrace to Fibonacci levels (e.g., 38.2%, 50%, 61.8%) after a significant move.
- Use Fibonacci levels in conjunction with other indicators for confirmation.
5. MACD (Moving Average Convergence Divergence)
MACD is a momentum indicator that shows the relationship between two moving averages of a security’s price.
- Effectiveness: Identifies potential trend changes and momentum shifts.
-
How to Use:
- Buy when the MACD line crosses above the signal line.
- Sell when the MACD line crosses below the signal line.
- Look for divergences between price and MACD to signal potential reversals.
Indicators to Use with Caution
Some indicators are less reliable or can produce false signals:
- Overly Complex Indicators: Indicators with too many parameters can be difficult to interpret and optimize.
- Lagging Indicators: Indicators that react slowly to price changes may provide late signals.
- Indicators Used in Isolation: Relying on a single indicator can be risky.
Best Practices for Using Technical Indicators
- Combine Indicators: Use multiple indicators to confirm signals and reduce false positives.
- Consider the Context: Analyze indicators within the broader market context and price action.
- Use Appropriate Timeframes: Select indicators and settings that align with your trading timeframe.
- Backtest Strategies: Test your trading strategies with indicators on historical data.
- Manage Risk: Always use stop-loss orders and manage your position size.
Conclusion
Technical indicators can be valuable tools for traders, but it’s crucial to understand their strengths and limitations. By focusing on reliable indicators like moving averages, RSI, volume, Fibonacci retracements, and MACD, and using them wisely, you can improve your trading decisions and increase your chances of success.
Related Keywords
Technical analysis indicators, best technical indicators, most reliable indicators, technical indicators that work, price movement prediction, stock trading indicators, technical analysis tools, technical analysis strategies, indicator analysis, trading indicators.
Frequently Asked Questions (FAQ)
1. What is technical analysis?
Technical analysis is a method of evaluating securities by analyzing historical market data, such as price and volume, to forecast future price movements.
2. What are technical indicators?
Technical indicators are calculations based on historical price and volume data that aim to predict future price movements.
3. What are the different types of technical indicators?
Technical indicators can be categorized into trend indicators, momentum indicators, volume indicators, and volatility indicators.
4. Which technical indicators are considered effective?
Effective indicators include moving averages, RSI, volume, Fibonacci retracements, and MACD, when used correctly.
5. How do moving averages help in technical analysis?
Moving averages smooth out price data to identify trends and potential support and resistance levels.
6. What does the Relative Strength Index (RSI) measure?
RSI measures the magnitude of recent price changes to evaluate overbought or oversold conditions.
7. Why is volume important in technical analysis?
Volume confirms the strength of price trends and breakouts; increasing volume strengthens a trend.
8. What are Fibonacci retracements used for?
Fibonacci retracements help identify potential price targets and reversal points based on Fibonacci ratios.
9. How does MACD help in identifying trading opportunities?
MACD identifies potential trend changes and momentum shifts by showing the relationship between two moving averages of a security’s price.
10. What is the best way to use technical indicators?
The best way to use technical indicators is to combine multiple indicators, consider the context of price action, use appropriate timeframes, backtest strategies, and manage risk.