Fibonacci retracement is a popular technical analysis tool that traders use to identify potential support and resistance levels. By understanding how to use Fibonacci retracement tools effectively, you can improve your trade entries and increase your chances of success. This article provides a comprehensive guide on using Fibonacci retracement for precise entry points.
Understanding Fibonacci Retracement
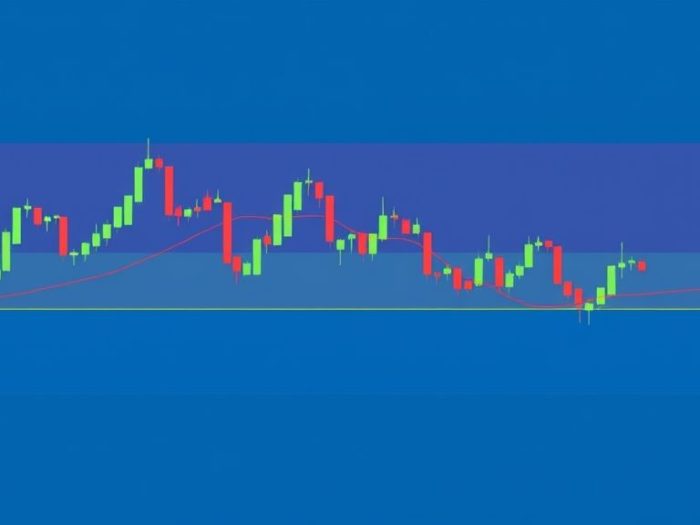
Fibonacci retracement levels are horizontal lines that indicate areas of support or resistance based on the Fibonacci sequence. The most commonly used Fibonacci retracement levels are 23.6%, 38.2%, 50%, 61.8%, and 78.6%. These levels are calculated by dividing a vertical distance between a significant high and low by the Fibonacci ratios.
Key Concepts
- Uptrend: A series of higher highs and higher lows.
- Downtrend: A series of lower highs and lower lows.
- Swing High: A peak in price action.
- Swing Low: A trough in price action.
- Retracement: A temporary price reversal within a larger trend.
How to Use Fibonacci Retracement Tools
Here’s a step-by-step guide on using Fibonacci retracement tools:
1. Identify a Significant Trend
Fibonacci retracement is most effective when used within a clear trend. Identify whether the market is in an uptrend or a downtrend.
2. Locate the Swing High and Swing Low
In an uptrend, identify the most recent significant swing low and the subsequent swing high. In a downtrend, identify the most recent significant swing high and the subsequent swing low.
3. Draw the Fibonacci Retracement Tool
On your charting platform, select the Fibonacci retracement tool.
- Uptrend: Click on the swing low and drag the cursor to the swing high.
- Downtrend: Click on the swing high and drag the cursor to the swing low.
4. Identify Potential Entry Points
The Fibonacci retracement tool will automatically draw horizontal lines at the Fibonacci levels. These levels represent potential areas where the price may find support in an uptrend or resistance in a downtrend.
5. Confirm with Other Indicators
Fibonacci retracement levels are more reliable when confirmed by other technical indicators. Look for confluence with:
- Moving Averages: If a Fibonacci level aligns with a moving average, it strengthens the support or resistance.
- RSI: If the RSI is oversold in an uptrend near a Fibonacci level, it increases the probability of a bounce.
- Volume: Increased volume at a Fibonacci level can confirm its significance.
- Candlestick Patterns: Reversal candlestick patterns at Fibonacci levels can signal potential entry points.
Examples
Example 1: Uptrend Entry
In an uptrend, the price retraces to the 38.2% Fibonacci level, which also aligns with a rising moving average. This confluence suggests a strong potential entry point for a long position.
Example 2: Downtrend Entry
In a downtrend, the price retraces to the 61.8% Fibonacci level, where a bearish engulfing candlestick pattern forms. This confluence indicates a potential entry point for a short position.
Important Considerations
- Subjectivity: Identifying significant swing highs and lows can be subjective.
- Not a Guarantee: Fibonacci levels are potential areas of support or resistance, not guaranteed entry points.
- Use in Conjunction: Always use Fibonacci retracement with other technical analysis tools for confirmation.
- Timeframes: Fibonacci retracement works on all timeframes, but higher timeframes generally provide more reliable signals.
Conclusion
Fibonacci retracement is a valuable tool for identifying potential entry points in trading. By combining Fibonacci levels with other technical indicators and considering the overall market context, you can increase the accuracy of your trades. Remember that no indicator is foolproof, and risk management is always essential.
Related Keywords
Fibonacci retracement, Fibonacci levels, Fibonacci trading, Fibonacci entry points, Fibonacci tool, Fibonacci analysis, how to use Fibonacci, Fibonacci support and resistance, Fibonacci trading strategy, Fibonacci for beginners.
Frequently Asked Questions (FAQ)
1. What is Fibonacci retracement?
Fibonacci retracement is a technical analysis tool that uses horizontal lines to indicate potential support or resistance levels based on Fibonacci ratios.
2. What are the common Fibonacci retracement levels?
The most common levels are 23.6%, 38.2%, 50%, 61.8%, and 78.6%.
3. How do you draw Fibonacci retracement in an uptrend?
In an uptrend, you click on the swing low and drag the tool to the swing high.
4. How do you draw Fibonacci retracement in a downtrend?
In a downtrend, you click on the swing high and drag the tool to the swing low.
5. What do Fibonacci levels represent?
Fibonacci levels represent potential areas where the price may find support in an uptrend or resistance in a downtrend.
6. Should you rely solely on Fibonacci retracement for entry points?
No, it’s crucial to confirm Fibonacci levels with other technical indicators.
7. What indicators can confirm Fibonacci retracement levels?
Confirming indicators include moving averages, RSI, volume, and candlestick patterns.
8. Are Fibonacci levels guaranteed entry points?
No, Fibonacci levels are potential areas of support or resistance, not guaranteed entry points.
9. Does Fibonacci retracement work on all timeframes?
Yes, Fibonacci retracement works on all timeframes, but higher timeframes generally provide more reliable signals.
10. How can Fibonacci retracement improve trading decisions?
By identifying potential entry points with greater accuracy, Fibonacci retracement can help traders improve their risk-to-reward ratio and increase their chances of success.