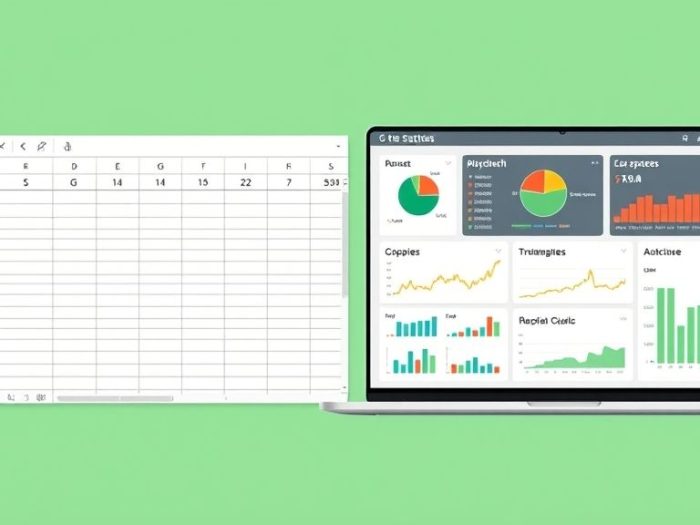
Stock analysis is crucial for making informed investment decisions. Investors often
face the dilemma of choosing between familiar tools like Excel and specialized
software designed for financial analysis. This article compares Excel and specialized
software for stock analysis, helping you determine the best tools for your needs.
Understanding the Tools
Excel
Microsoft Excel is a spreadsheet program widely used for data organization,
calculation, and visualization. Its flexibility allows users to perform various
financial analyses.
Specialized Software
Specialized software is designed explicitly for financial analysis, offering
pre-built functions, data feeds, and advanced analytical tools. Examples include
Bloomberg Terminal, FactSet, and various stock analysis platforms.
Comparison: Excel vs. Specialized Software
| Feature | Excel | Specialized Software |
|---|---|---|
| Data Acquisition | Manual input, web scraping, limited API integration | Real-time data feeds, comprehensive databases, robust API integration |
| Analytical Functions | Basic to intermediate financial functions | Advanced financial modeling, valuation, and risk analysis tools |
| Customization | Highly customizable | Varies, often less customizable for core functions |
| Visualization | Basic to intermediate charts and graphs | Advanced charting, data visualization, and reporting |
| Cost | Relatively low (if already own Microsoft Office) | Can be very high (subscription-based) |
| Learning Curve | Familiar to most users, advanced functions require expertise | Varies, can be steep for complex software |
When to Use Excel for Stock Analysis
Excel is a good choice for:
-
Basic Analysis: Performing simple calculations like ratio analysis
or creating basic financial statements. -
Customizable Modeling: Building custom financial models or
valuation spreadsheets. -
Data Organization: Organizing and managing stock data in a way
that suits your needs. -
Cost-Effectiveness: When you need a cost-effective solution and
already have Excel.
When to Use Specialized Software for Stock Analysis
Specialized software is preferred for:
-
Advanced Analysis: Conducting complex valuation, risk management,
or portfolio optimization. - Real-Time Data: Accessing real-time market data and news.
-
Professional Use: In finance professionals who require
industry-standard tools. -
Efficiency: When you need to automate tasks and save time on data
collection and processing.
Examples
-
Excel: An individual investor creating a discounted cash flow
(DCF) model or tracking their portfolio performance. -
Specialized Software: A financial analyst using a Bloomberg
Terminal to analyze market trends, value companies, and manage portfolios.
The Hybrid Approach
Many professionals use a combination of both tools. They might use specialized
software for data acquisition and complex analysis, then export data to Excel for
customization and reporting.
Conclusion
The best tool for stock analysis depends on your needs, budget, and expertise.
Excel is a versatile and cost-effective option for basic to intermediate analysis,
while specialized software offers advanced capabilities for professionals and
complex tasks. Consider your specific requirements to make an informed decision.
Related Keywords
Excel for stock analysis, stock analysis software, best tools for stock analysis,
financial analysis tools, stock market analysis software, compare Excel vs.
Bloomberg, stock valuation software, stock data analysis, financial modeling
software, investment analysis tools.
Frequently Asked Questions (FAQ)
1. What is Excel used for in stock analysis?
Excel is used for basic to intermediate stock analysis, such as ratio
analysis, creating financial statements, and building custom financial
models.
2. What is specialized software for stock analysis?
Specialized software is designed explicitly for financial analysis, offering
advanced functions, real-time data feeds, and tools for valuation and risk
analysis.
3. What are the advantages of using Excel for stock analysis?
Advantages of Excel include its customizability, cost-effectiveness (if you
already own it), and familiarity to many users.
4. What are the disadvantages of using Excel for stock analysis?
Disadvantages of Excel include limited data acquisition capabilities,
basic analytical functions compared to specialized software, and potential
for errors in complex models.
5. When should I use specialized software for stock analysis?
Use specialized software for advanced analysis, real-time data access,
professional finance use, and to automate time-consuming tasks.
6. What are the advantages of specialized software?
Advantages of specialized software include real-time data feeds, advanced
analytical tools, and powerful data visualization.
7. What are the disadvantages of specialized software?
Disadvantages of specialized software include high cost (subscription
fees) and a potentially steep learning curve.
8. Is it possible to use both Excel and specialized software?
Yes, many professionals use a hybrid approach, combining the strengths
of both tools. For example, using specialized software for data and
Excel for customization.
9. For a beginner investor, is Excel sufficient?
For basic stock analysis and portfolio tracking, Excel can be sufficient
for beginner investors.
10. When should I consider upgrading to specialized software?
Consider upgrading to specialized software as your analysis becomes
more complex, you need real-time data, or you work in a professional
finance setting.


