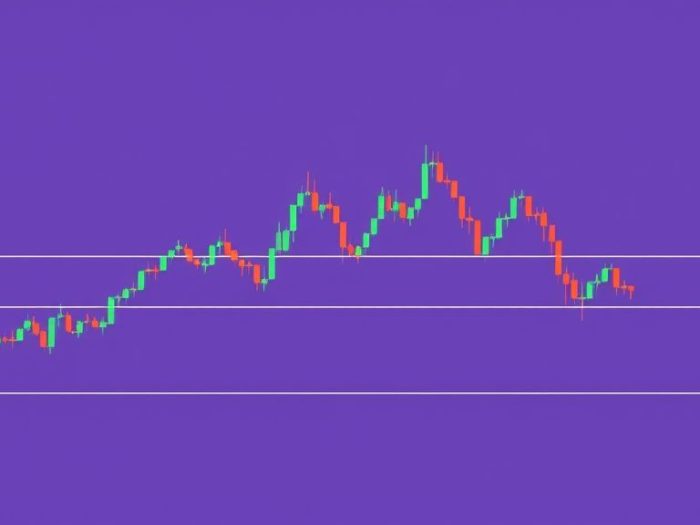
Support and resistance levels are fundamental concepts in forex trading. Identifying
these levels accurately can significantly improve your trading decisions and increase
your chances of success. This article provides a comprehensive guide on how to identify
support and resistance levels like a professional trader.
Understanding Support and Resistance
Support and resistance levels are price levels on a chart where the price tends to
stop and reverse.
-
Support: A price level where the price tends to stop falling. Buying
pressure is strong enough to prevent further decline. -
Resistance: A price level where the price tends to stop rising.
Selling pressure is strong enough to prevent further increase.
Why Are Support and Resistance Important?
-
Entry and Exit Points: Traders use support and resistance levels to
identify potential entry and exit points for trades. -
Stop-Loss and Take-Profit: They help in placing stop-loss and
take-profit orders. - Trend Confirmation: They confirm the strength of a trend.
- Risk Management: They aid in assessing risk and reward.
Methods to Identify Support and Resistance Levels
1. Swing Highs and Lows
Swing highs are peaks in price action, while swing lows are troughs. These points
often act as support and resistance.
- How to Identify: Look for distinct peaks and valleys on the chart.
-
Significance: The more prominent the swing high or low, the stronger
the support or resistance.
2. Trend Lines
Trend lines are lines connecting a series of higher lows (uptrend) or lower highs
(downtrend).
-
How to Identify: Draw a line connecting at least two or more
significant highs or lows. -
Significance: Trend lines can act as dynamic support or
resistance.
3. Fibonacci Retracement Levels
Fibonacci retracement levels are horizontal lines that indicate potential support
or resistance based on Fibonacci ratios.
-
How to Identify: Use the Fibonacci retracement tool on your charting
platform to connect a significant swing high and swing low. - Significance: Common levels include 38.2%, 50%, and 61.8%.
4. Moving Averages
Moving averages can act as dynamic support or resistance, especially longer-term
moving averages.
-
How to Identify: Plot moving averages on your chart (e.g., 50-period,
200-period). -
Significance: The price often bounces off or respects moving
averages.
5. Psychological Levels
Psychological levels are round numbers (e.g., 1.2000, 1.3000) that can act as support
or resistance.
- How to Identify: These levels are easily identifiable on the chart.
- Significance: Traders tend to place orders around these levels.
Combining Methods for Confirmation
It’s crucial to use multiple methods to confirm support and resistance levels. The
more methods that converge at a level, the stronger it becomes.
Example
A potential support level could be identified by:
- A previous swing low.
- A trend line.
- A 50% Fibonacci retracement level.
Important Considerations
-
Subjectivity: Identifying support and resistance can be somewhat
subjective. -
Breakouts and Breakdowns: Price can break through these levels,
signaling potential trend changes. -
Timeframes: Support and resistance are valid on all timeframes, but
higher timeframes generally have stronger levels. -
Zones, Not Exact Lines: Support and resistance are often zones, not
exact lines.
Conclusion
Identifying support and resistance levels is a fundamental skill for forex traders.
By using a combination of methods and understanding their significance, you can
improve your trade entries and exits, manage risk effectively, and increase your
chances of success.
Related Keywords
Forex support and resistance, identify support and resistance, forex trading
strategy, technical analysis, trading support and resistance, forex trading for
beginners, price action trading, forex chart patterns, forex trading tools, forex
trading guide.
Frequently Asked Questions (FAQ)
1. What are support and resistance levels?
Support and resistance levels are price levels on a chart where the price
tends to stop and reverse. Support is where the price tends to stop falling,
and resistance is where the price tends to stop rising.
2. Why are support and resistance levels important in forex trading?
They are important for identifying potential entry and exit points, placing
stop-loss and take-profit orders, confirming trends, and assessing risk and
reward.
3. What are swing highs and lows?
Swing highs are peaks in price action, while swing lows are troughs. They
often act as support and resistance levels.
4. How do trend lines help in identifying support and resistance?
Trend lines connect a series of higher lows (uptrend) or lower highs
(downtrend) and can act as dynamic support or resistance.
5. What are Fibonacci retracement levels?
Fibonacci retracement levels are horizontal lines that indicate potential
support or resistance based on Fibonacci ratios.
6. Can moving averages act as support and resistance?
Yes, moving averages, especially longer-term ones, can act as dynamic
support or resistance.
7. What are psychological levels?
Psychological levels are round numbers (e.g., 1.2000, 1.3000) that can act as
support or resistance due to traders tending to place orders around them.
8. Should I rely on a single method to identify support and resistance?
No, it’s crucial to use multiple methods to confirm support and resistance
levels. The more methods that converge at a level, the stronger it becomes.
9. Are support and resistance levels exact lines?
No, support and resistance are often zones, not exact lines. Price may
bounce within a range around these levels.
10. Do support and resistance levels hold true on all timeframes?
Yes, support and resistance are valid on all timeframes, but higher
timeframes generally have stronger levels.


