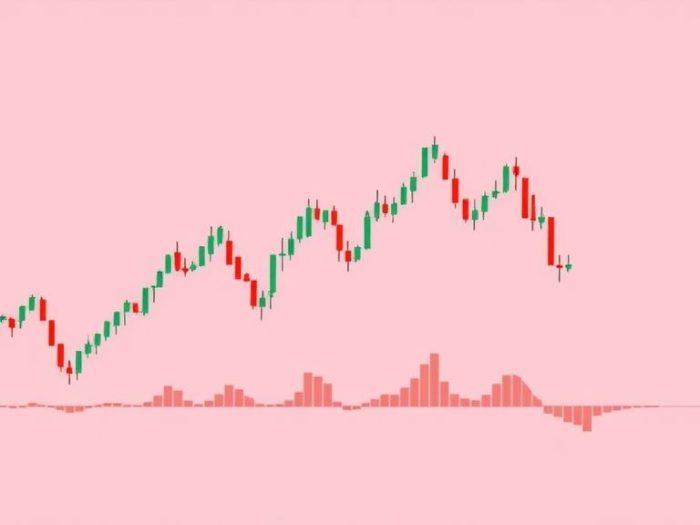
Forex trading can be approached in various ways, and price action trading is a
popular method that focuses on analyzing the raw price movement of currency pairs
without relying heavily on indicators or complex algorithms. This article explores
how to trade forex using price action, emphasizing its principles and practical
applications.
Understanding Price Action
Price action analysis involves observing and interpreting the patterns and
structures that form on a price chart. Traders analyze candlestick patterns,
support and resistance levels, trend lines, and chart patterns to make trading
decisions.
Benefits of Price Action Trading
- Simplicity: It eliminates the clutter of numerous indicators.
-
Leading Indicator: Price action is often considered a leading
indicator, as it reflects the direct buying and selling pressure in the market. -
Universality: Price action principles apply across all markets
and timeframes. - Flexibility: It allows for adaptable trading strategies.
Key Price Action Concepts
1. Candlestick Patterns
Candlestick patterns are visual representations of price movements within a specific
timeframe.
-
Bullish Patterns: Indicate potential upward price movement (e.g.,
Engulfing, Hammer). -
Bearish Patterns: Indicate potential downward price movement (e.g.,
Engulfing, Shooting Star). -
Continuation Patterns: Suggest the current trend will continue
(e.g., Flags, Pennants).
2. Support and Resistance
Support levels are price levels where the price tends to stop falling, while
resistance levels are where the price tends to stop rising.
-
Identifying: Look for previous highs and lows, trend lines, and
Fibonacci levels. -
Trading: Buy near support and sell near resistance, or trade
breakouts of these levels.
3. Trend Lines
Trend lines connect a series of higher lows (uptrend) or lower highs (downtrend) to
visualize the prevailing trend.
-
Trading: Buy near an uptrend line and sell near a downtrend line,
or trade trend line breaks.
4. Chart Patterns
Chart patterns are recognizable formations on a price chart that can predict future
price movements.
-
Reversal Patterns: Signal a potential change in trend (e.g.,
Head and Shoulders, Double Top). -
Continuation Patterns: Suggest the current trend will continue
(e.g., Flags, Pennants).
A Simple Price Action Trading Strategy
This is a basic example and should be further refined based on your preferences.
1. Identify the Trend
Use a higher timeframe (e.g., daily chart) to determine the overall trend.
2. Find Key Levels
Mark significant support and resistance levels on the chart.
3. Watch for Candlestick Patterns
On a lower timeframe (e.g., 4-hour chart), watch for bullish reversal patterns near
support in an uptrend, or bearish reversal patterns near resistance in a downtrend.
4. Entry and Exit
-
Entry: Enter a trade when the candlestick pattern confirms the
potential reversal. -
Stop Loss: Place your stop loss below the support level for long
trades or above the resistance level for short trades. -
Take Profit: Set your take profit at the next significant
resistance level (for longs) or support level (for shorts).
Important Considerations
-
Subjectivity: Price action analysis can be subjective, and
different traders may interpret patterns differently. - Confirmation: Always seek confirmation from multiple factors.
- Risk Management: Proper risk management is essential.
-
Practice: Practice price action analysis on demo accounts before
trading live.
Conclusion
Price action trading offers a clean and versatile approach to forex trading. By
understanding candlestick patterns, support and resistance, trend lines, and chart
patterns, traders can make informed decisions based on the raw price movement of
currency pairs. However, remember that price action analysis requires practice,
discipline, and a solid understanding of market dynamics.
Related Keywords
Forex price action, price action trading, forex trading strategy, technical
analysis, candlestick patterns, support and resistance, trend lines, chart
patterns, forex trading for beginners, forex trading tips.
Frequently Asked Questions (FAQ)
1. What is price action trading?
Price action trading involves analyzing the raw price movement of currency
pairs to make trading decisions, without relying heavily on indicators or
algorithms.
2. What are the benefits of using price action?
Benefits include simplicity, it being a leading indicator, universality, and
flexibility.
3. What are candlestick patterns?
Candlestick patterns are visual representations of price movements within a
specific timeframe, used to identify potential trading opportunities.
4. What are support and resistance levels?
Support levels are price levels where the price tends to stop falling, while
resistance levels are where the price tends to stop rising.
5. What are trend lines?
Trend lines connect a series of higher lows (uptrend) or lower highs
(downtrend) to visualize the prevailing trend.
6. What are chart patterns?
Chart patterns are recognizable formations on a price chart that can predict
future price movements.
7. What is a reversal pattern?
A reversal pattern is a chart pattern that signals a potential change in
trend.
8. What is a continuation pattern?
A continuation pattern is a chart pattern that suggests the current trend
will continue.
9. Is price action trading subjective?
Yes, price action analysis can be subjective, as different traders may
interpret patterns differently.
10. Should I rely solely on price action for trading decisions?
While price action is valuable, it’s generally recommended to seek
confirmation from multiple factors and use proper risk management.


