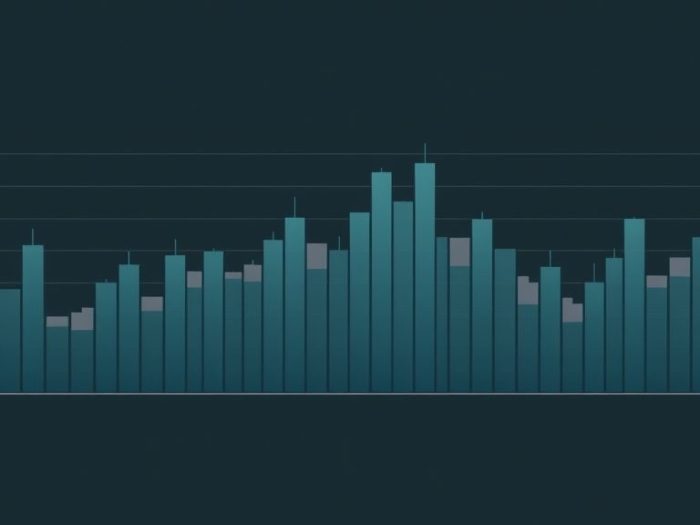
Volume Profile is a powerful charting tool that displays trading volume at specific price levels
over a specified period. Algorithmic trading strategies can leverage Volume Profile data to
identify high-probability trading zones. This article explores how to use Volume Profile algorithms
for improved trade entries and exits.
Understanding Volume Profile
Volume Profile provides a horizontal histogram on a price chart, showing the volume traded at
each price level. Key components include:
- Value Area (VA): The price range where the majority (typically 70%) of the volume occurred.
- Point of Control (POC): The price level with the highest trading volume within the Value Area.
- High Volume Nodes (HVNs): Price levels with significant trading volume.
- Low Volume Nodes (LVNs): Price levels with relatively low trading volume.
Why Use Volume Profile in Algorithmic Trading?
Volume Profile helps identify:
- Support and Resistance: High Volume Nodes often act as support or resistance.
- Value Areas: Price is likely to trade within the Value Area.
- Breakout and Breakdown Points: Low Volume Nodes can be breached more easily.
- Market Acceptance: The Point of Control indicates the price level where the market has found the most agreement.
Building Volume Profile Algorithms
1. Data Acquisition
Obtain historical price and volume data that includes volume information at each price level.
2. Volume Profile Calculation
Calculate the Volume Profile for a specific period (e.g., daily, session).
3. Identify Key Levels
Develop algorithms to identify:
- Value Area High (VAH)
- Value Area Low (VAL)
- Point of Control (POC)
- High Volume Nodes (HVNs)
- Low Volume Nodes (LVNs)
4. Entry and Exit Rules
Define trading rules based on Volume Profile levels. Examples:
- Long Entry: Buy when the price bounces off a High Volume Node within the Value Area.
- Short Entry: Sell when the price fails to break above the Value Area High.
- Take Profit: Set at the next High Volume Node or the opposite end of the Value Area.
- Stop Loss: Place below a High Volume Node for long trades or above for short trades.
5. Backtesting
Thoroughly backtest the algorithm on historical data to evaluate its performance.
Example: Volume Profile Breakout Strategy
- Condition: Identify a Low Volume Node (LVN) above a Value Area.
- Entry: Buy when the price breaks above the LVN.
- Take Profit: Set at the next High Volume Node.
- Stop Loss: Place below the Value Area High.
Important Considerations
- Timeframe: The effectiveness of Volume Profile can vary across different timeframes.
- Volume Data Accuracy: Use reliable and accurate volume data.
- Market Conditions: Volume Profile may be less effective in strongly trending markets.
- Parameter Optimization: Carefully optimize parameters for Value Area calculation and other settings.
- Computational Resources: Calculating and analyzing Volume Profile data can be computationally intensive.
Conclusion
Volume Profile algorithms offer a powerful way to identify high-probability trading levels.
However, they require careful implementation, thorough backtesting, and a good understanding of
market dynamics.
Related Keywords
Volume Profile, algorithmic trading, options trading, stock trading, forex trading, trading
algorithms, trading indicators, price action, market analysis, trading strategy.
Frequently Asked Questions (FAQ)
1. What is Volume Profile?
Volume Profile is a charting tool that displays trading volume at specific price
levels over a specified period.
2. What is the Value Area (VA)?
The Value Area is the price range where the majority (typically 70%) of the trading
volume occurred.
3. What is the Point of Control (POC)?
The Point of Control (POC) is the price level with the highest trading volume within
the Value Area.
4. What are High Volume Nodes (HVNs)?
High Volume Nodes (HVNs) are price levels where a significant amount of trading
volume occurred.
5. What are Low Volume Nodes (LVNs)?
Low Volume Nodes (LVNs) are price levels where relatively little trading volume
occurred.
6. How can Volume Profile be used to identify support and resistance?
High Volume Nodes often act as support or resistance levels, as they represent
price levels where there’s significant buying or selling interest.
7. What is the significance of the Point of Control (POC)?
The Point of Control indicates the price level where the market has found the most
agreement on value. Price often gravitates towards the POC.
8. How can Volume Profile help identify breakout or breakdown points?
Low Volume Nodes can be breached more easily, making them potential breakout or
breakdown points.
9. What are the key steps in building a Volume Profile trading algorithm?
Key steps include data acquisition, Volume Profile calculation, identification of
key levels (VAH, VAL, POC, HVNs, LVNs), entry and exit rule definition, and
backtesting.
10. What are the limitations of using Volume Profile algorithms?
Limitations include potential variations in effectiveness across different
timeframes, the need for accurate volume data, and potential reduced effectiveness in
strongly trending markets.


