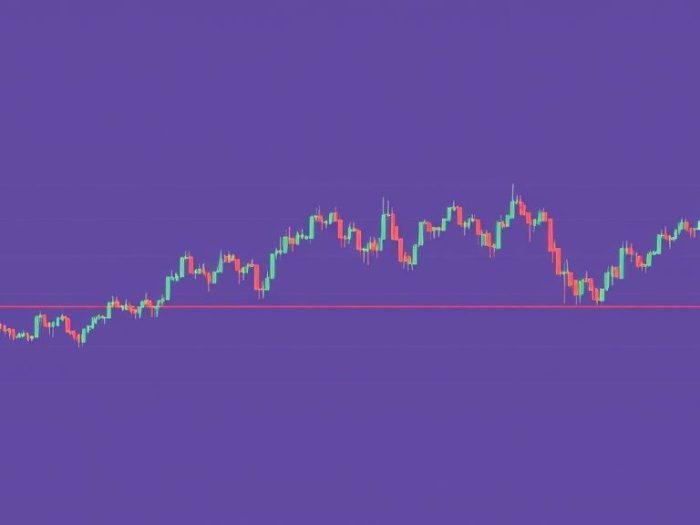
Mean reversion is a trading concept that suggests prices tend to revert to their average over time.
Algorithmic trading strategies based on mean reversion aim to profit from these price fluctuations.
While a guaranteed 70%+ win rate is unrealistic in trading, this article explores backtested
mean reversion strategies that can offer high probability setups when implemented carefully.
Understanding Mean Reversion
Mean reversion implies that if a price deviates significantly from its average, it’s likely to
return to that average. This concept is often applied to assets that trade within a range or exhibit
sideways movement.
Key Components of Mean Reversion Algorithms
- Moving Averages: Used to identify the average price over a specific period.
- Oscillators: Indicators like the Relative Strength Index (RSI) or Stochastic Oscillator to identify overbought or oversold conditions.
- Standard Deviation: A measure of price volatility used to define price ranges.
- Entry and Exit Rules: Precise conditions for entering and exiting trades.
- Backtesting: Testing the strategy on historical data to evaluate its performance.
Backtested Mean Reversion Strategies (Examples)
(Disclaimer: Backtested results are hypothetical and do not guarantee future performance.
These are simplified examples and require thorough testing and optimization.)
1. RSI Mean Reversion
-
Entry:
- Buy when the price is below the lower Bollinger Band and the RSI is oversold (below 30).
-
Exit:
- Sell when the price reaches the moving average or the RSI is overbought (above 70).
-
Rationale:
- Combines the price range (Bollinger Bands) with momentum (RSI) to identify high-probability reversal points.
2. Stochastic Oscillator Reversal
-
Entry:
- Buy when the Stochastic Oscillator crosses above the oversold level (e.g., 20).
-
Exit:
- Sell when the Stochastic Oscillator crosses below the overbought level (e.g., 80).
-
Rationale:
- Uses the Stochastic Oscillator to pinpoint potential price reversals in a defined range.
3. Standard Deviation Channel
-
Entry:
- Buy when the price touches the lower standard deviation band.
-
Exit:
- Sell when the price touches the upper standard deviation band or the moving average.
-
Rationale:
- Assumes that the price will likely stay within a certain number of standard deviations from its average.
Achieving Higher Probability Setups
To improve the probability of success, consider these factors:
- Timeframe Selection: Longer timeframes generally provide more reliable signals.
- Market Conditions: Mean reversion strategies work best in sideways or range-bound markets. Avoid strong trending markets.
- Parameter Optimization: Carefully adjust the parameters of your indicators and entry/exit rules based on backtesting.
- Confirmation: Use multiple indicators or price action patterns to confirm entry and exit signals.
- Risk Management: Always use stop-loss orders and manage your position size.
Important Disclaimer
Backtested results are hypothetical and do not guarantee future performance. Achieving a
consistent 70%+ win rate in real-world trading is challenging and not guaranteed. The forex
market is inherently risky, and losses are possible. This information is for educational
purposes only and not financial advice.
Conclusion
Mean reversion algorithms can be a valuable tool for traders seeking high-probability setups.
However, it’s crucial to understand their limitations, carefully backtest and optimize your
strategies, and manage risk effectively.
Related Keywords
Mean reversion, mean reversion strategy, mean reversion algorithm, algorithmic trading,
quantitative trading, high probability trading, forex trading strategy, stock trading strategy,
backtesting, trading indicators.
Frequently Asked Questions (FAQ)
1. What is mean reversion?
Mean reversion is the theory that prices tend to deviate from their average but will
eventually return to that average over time.
2. What are the key components of mean reversion algorithms?
Key components include moving averages, oscillators (like RSI or Stochastic), standard
deviation, and entry/exit rules.
3. How are moving averages used in mean reversion?
Moving averages are used to identify the average price over a specific period, helping
traders determine if the current price is significantly deviated from the average.
4. What is the role of oscillators in mean reversion?
Oscillators like RSI and Stochastic help identify overbought or oversold conditions,
indicating potential price reversals.
5. What does standard deviation measure in this context?
Standard deviation measures price volatility and is used to define price ranges or
bands within which the price is expected to fluctuate.
6. What are entry and exit rules in a mean reversion algorithm?
Entry and exit rules are the precise conditions that trigger the algorithm to buy or
sell, based on the indicators and price levels.
7. Is a 70%+ win rate guaranteed with mean reversion algorithms?
No, a consistent 70%+ win rate is not guaranteed in real-world trading. Backtested
results are hypothetical and past performance is not indicative of future results.
8. Are mean reversion algorithms effective in all market conditions?
Mean reversion strategies work best in sideways or range-bound markets. They tend to
perform poorly in strong trending markets.
9. How important is backtesting for mean reversion algorithms?
Backtesting is crucial to evaluate the strategy’s performance on historical data and
optimize its parameters.
10. What are some of the key factors for successful mean reversion trading?
Key factors include careful timeframe selection, identifying appropriate market
conditions, parameter optimization, confirmation with other indicators, and strict risk
management.


