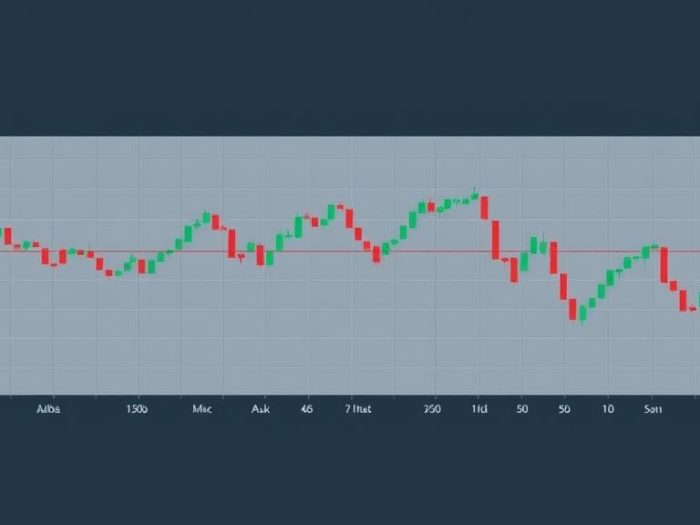
The Relative Strength Index (RSI) is one of the most popular technical indicators — and for good reason. It helps traders identify when an asset is overbought or oversold, signaling potential reversal points.
But to use RSI effectively, you need to understand more than just the numbers. This guide will show you how to read RSI like a pro and avoid common traps.
What is RSI?
RSI is a momentum oscillator that measures the speed and change of price movements. It outputs a value between 0 and 100 to indicate whether an asset is potentially overbought or oversold.
Key Levels:
- Above 70: Overbought (price may reverse down)
- Below 30: Oversold (price may reverse up)
Think of RSI as a “market thermometer” — it tells you when conditions are getting too hot or too cold.
How RSI is Calculated (Simplified)
RSI compares recent gains to recent losses over a set period (default is 14 periods).
No need to calculate manually — every charting tool like TradingView or LogicINV provides it automatically.
How to Use RSI Effectively
1. Spot Overbought and Oversold Conditions
When RSI crosses above 70, it suggests the asset might be overbought. When it drops below 30, it could be oversold.
But caution: These are signals to watch for a reversal — not automatic buy or sell orders.
2. Look for RSI Divergence
Divergence happens when price moves in one direction but RSI moves in the opposite.
- Bullish Divergence: Price makes lower lows, RSI makes higher lows ➞ Potential upward reversal.
- Bearish Divergence: Price makes higher highs, RSI makes lower highs ➞ Potential downward reversal.
3. Use RSI with Support & Resistance
RSI works best when combined with key price levels. For example:
- RSI < 30 AND price hits strong support ➞ Higher chance of a bounce.
Best Practices for RSI
- Don’t trade based on RSI alone — always confirm with other indicators or price action.
- Adjust RSI period settings for different assets (e.g., crypto may benefit from a 7 or 10 period).
- RSI is more reliable in ranging markets than strong trending markets.
Example: RSI in Action
In this example, notice how RSI signaled oversold conditions right as price approached a key support zone — followed by a strong bounce.
How LogicINV AI Enhances RSI Signals
LogicINV AI doesn’t just alert you when RSI hits 70 or 30. It:
- Confirms RSI signals with volume spikes, trend analysis, and sentiment shifts
- Detects RSI divergence automatically
- Filters out weak setups, so you only get high-quality alerts
Summary
- RSI helps identify potential reversal points using momentum data.
- Watch for overbought/oversold levels, but always confirm with context.
- Divergence is a powerful signal when used correctly.
➡️ Next Up: Avoid RSI Mistakes – Read Module 2.1E
Want smarter RSI alerts? Let LogicINV AI filter out the noise and highlight the best reversal opportunities. Start your free trial today!


